
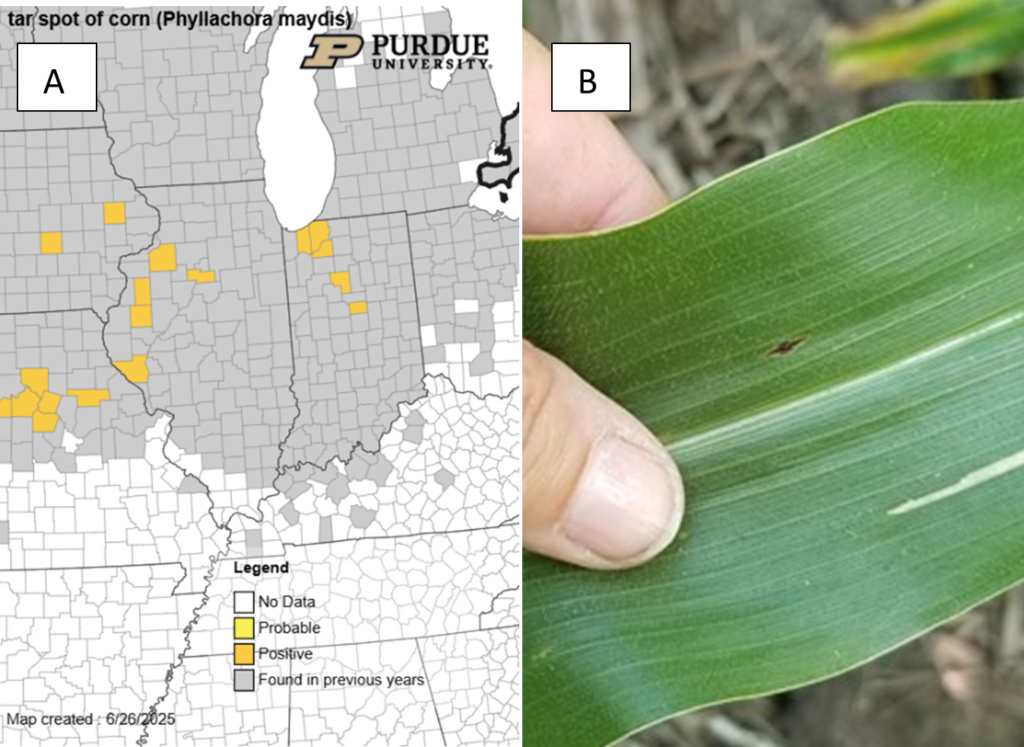
Most corn fields I have been in this week are pretty clean. A few diseases that I have seen include anthracnose, tar spot, and common rust in corn. We are tracking the activity of tar spot (map-Figure 1) and southern rust (map – Figure 2). On the tar spot map, you can see gray areas where we have detected the tar spot in past years (all 92 Indiana counties). In Indiana, we have confirmed tar spot for this season in 5 counties as of June 26, 2025. These include Cass, Porter, LaPorte, Starke, and Tipton counties. In the samples I have found it is still only a single tar spot stromata on a lower leaf in V8-V10 corn. This extremely hot weather is lowering the risk in the model (Figure 3). I would still wait to see what happens the next few weeks before pulling the fungicide trigger.
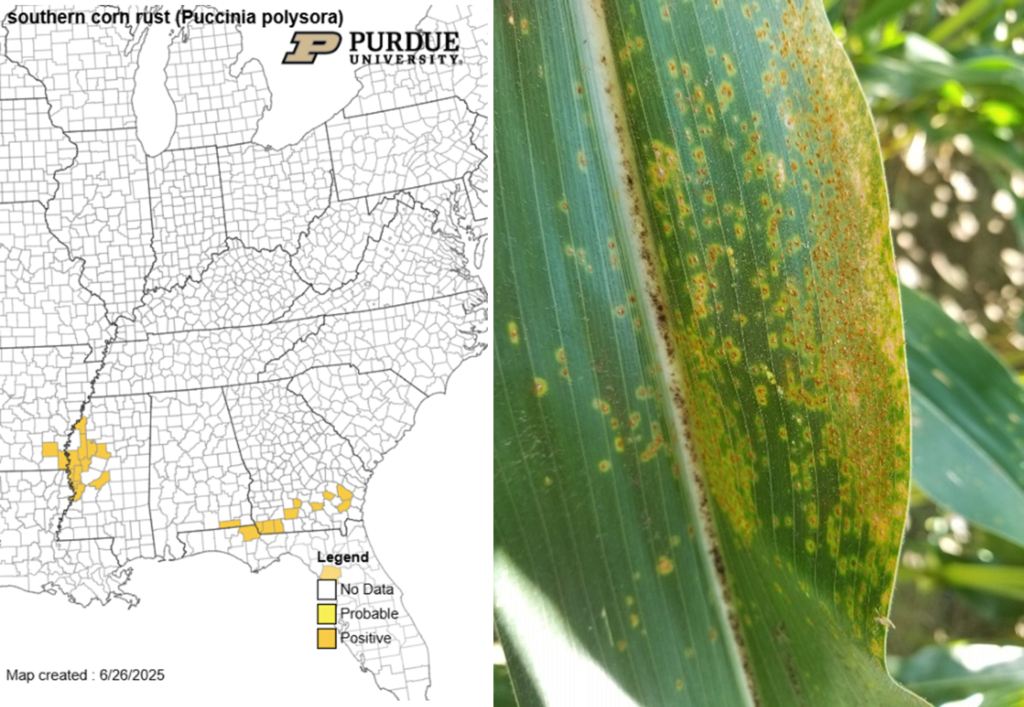
As for southern rust (Figure 2), it has yet to be detected in Indiana. A number of reports are currently coming out of Mississippi, Georgia, Florida, Alabama and Arkansas. We have seen some common rust, so it is important to keep an eye out and send samples in the PPDL if you suspect southern rust.
We will continue to monitor and provide updates – please keep sending us samples. Continue to scout your field to determine if any of these diseases are present. Gray leaf spot, northern corn leaf blight and tar spot are the diseases that are most commonly managed by fungicides in Indiana. For these diseases fungicides applied at VT-R1 are most effective at preventing yield loss. Scouting will help determine the level of disease pressure in a field and help you make an informed decision. See the fungicide efficacy tool to assist in based on your crop and disease target https://cropprotectionnetwork.org/fungicide-efficacy-tool.
A tar spot specific article on “Fungicide Application Reminders to Optimize Management of Tar Spot and Return on Investment in Corn” on Crop Protection Network, may also be a good reference. Check it out here: https://doi.org/10.31274/cpn-20240618-0
To make a decision for applying a fungicide there are four things I consider –
1. Disease risk in a field – do you have a previous history of the disease
2. Current disease activity – do you find the disease in the lower canopy while scouting
3. Weather conditions – will there continue to be favorable weather moisture and rain for foliar diseases? Check out the Crop Risk Tool (https://connect.doit.wisc.edu/cpn-risk-tool/)
4. Return on investment – will the yield protected by a fungicide cover the additional cost of the application? Check out a new tool to aid in this decision (https://cropprotectionnetwork.org/fungicide-roi-calculator)
Additional Resources:
Purdue Field Crop Pathology Extension Website: https://indianafieldcroppathology.com/
Crop Protection Network: https://cropprotectionnetwork.org/ – tar spot publication, efficacy tables, crop risk tools, fungicide ROI tool.
Map source: https://corn.ipmpipe.org/tar-spot/
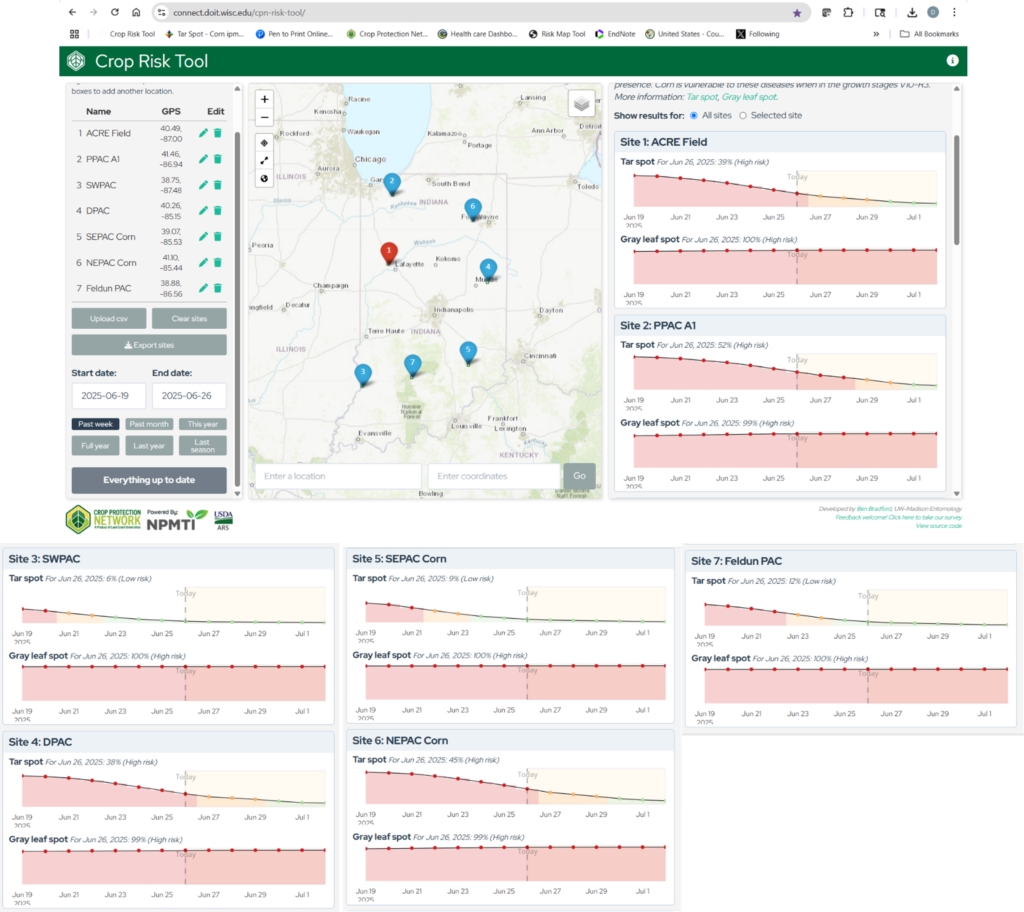
Across Indiana the risk of favorable environmental conditions for tar spot is much less (green vs red) than it was early in the week. The hot weather we have experienced is helping reduce the risk.