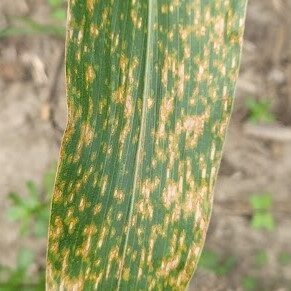
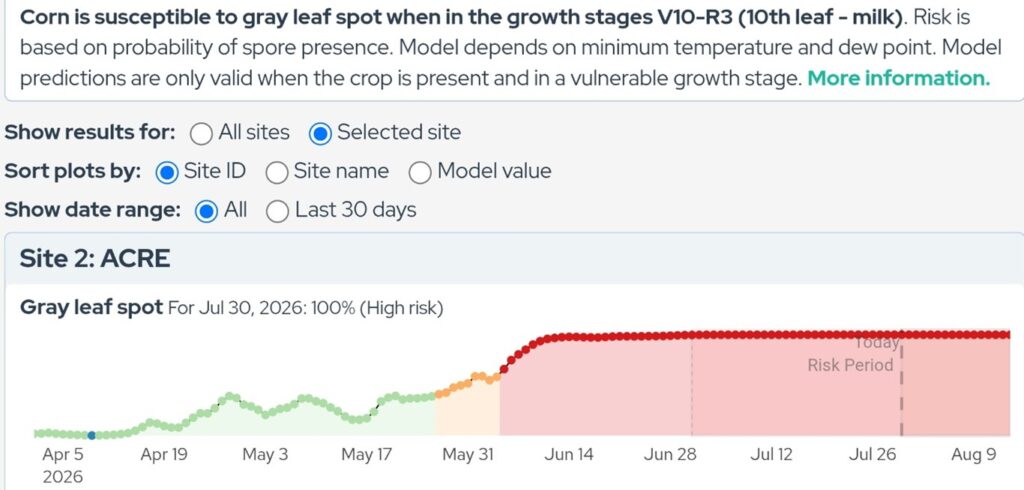
Foliar diseases are becoming increasingly evident in corn fields across Indiana, with gray leaf spot emerging as the most prevalent disease thus far this season. During our application of our silking (R1) fungicide trials this week, we observed significant gray leaf spot in the lower canopy of our susceptible hybrid planted our continuous no-till field (Figure 1). The Crop Risk Tool has indicated high risk conditions for gray leaf spot (Figure 2), so our observations were not unexpected.
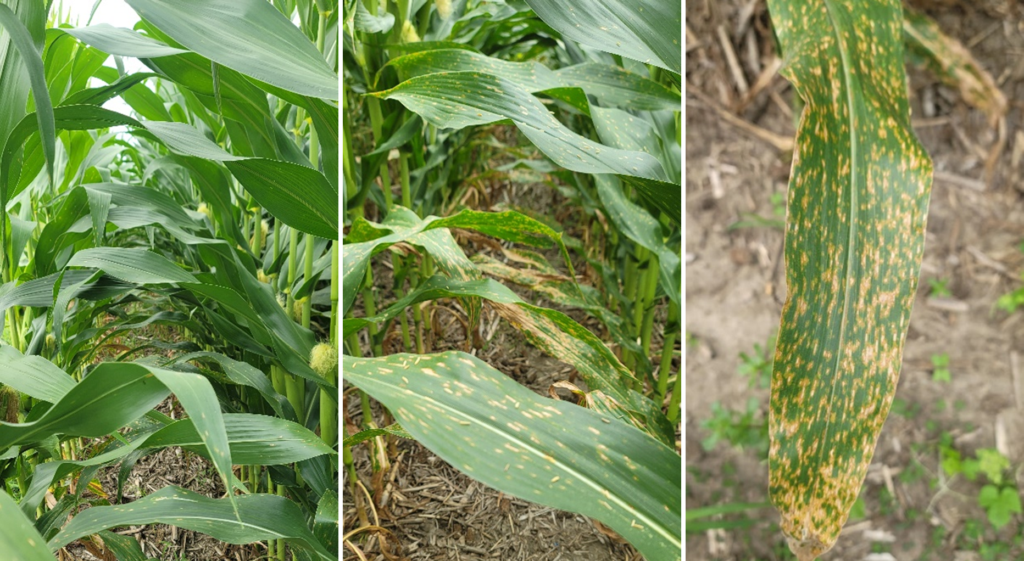
In addition, southern corn rust has now been confirmed in several localized areas across Indiana. It is highly likely the disease is present in additional corn fields beyond those currently reported (Figure 3). If you have not scouted fields recently, now is an excellent time to do so. We are interested in receiving leaf samples from any county where the disease has not been reported on the distribution map. We have also observed northern corn leaf blight, Curvularia leaf spot (Figure 4), and tar spot at many of our research sites across the state.
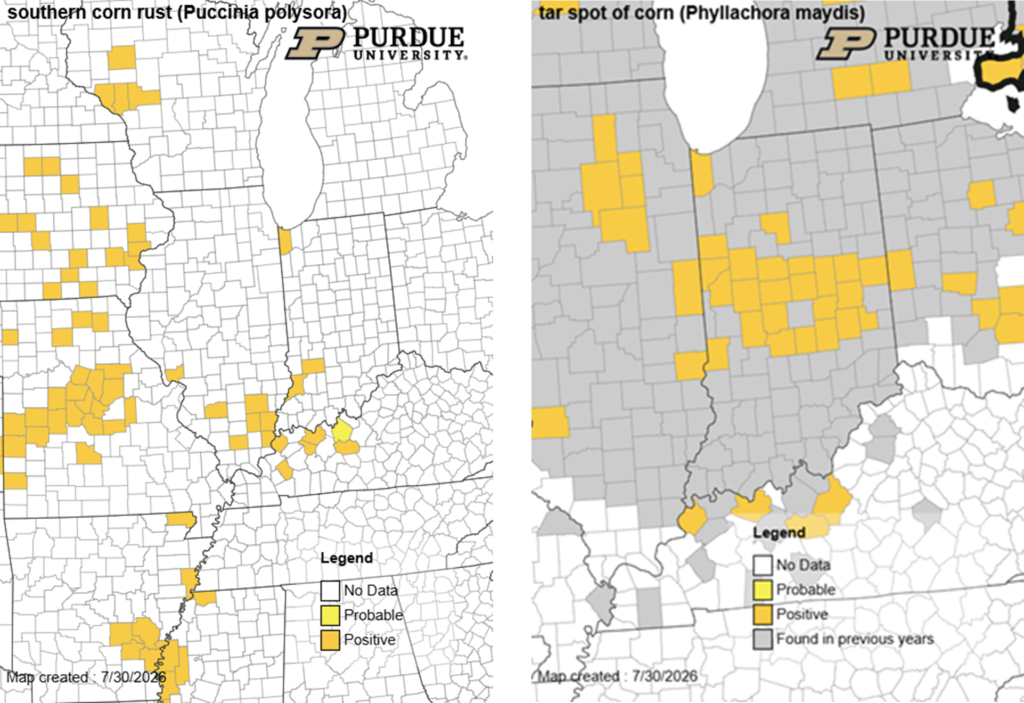
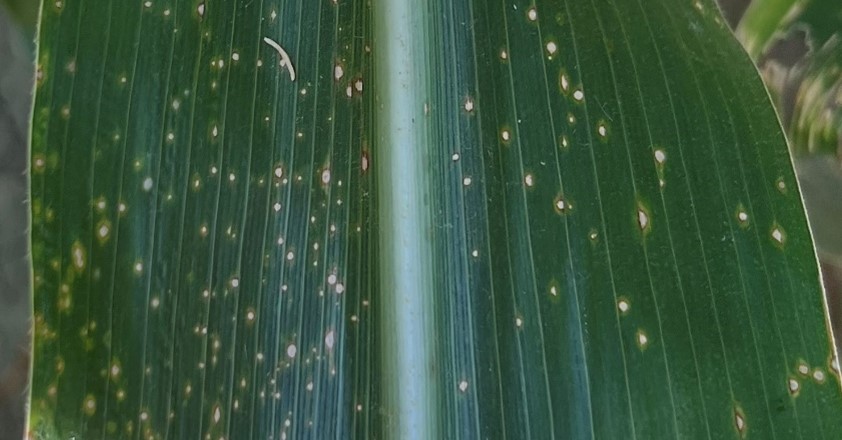
Tar spot can now be found in many corn fields across central Indiana (Figure 3). Although recent environmental conditions have limited it movement into the upper canopy, disease development has continued in many locations. Weather patterns have become more favorable and I expect tar spot to increase in severity and move higher in the canopy over the next few weeks. Continued scouting will be important to monitor disease progression and assess potential management needs.
I know there are still some questions on if a fungicide application should be made. A fungicide application can be effective at reducing disease and protecting yield, but there are a number of factors that need to consider. Here are my thoughts on what to consider.
- Assess disease pressure by identifying which diseases are present, their location in the canopy, and how extensively they have spread throughout the field.
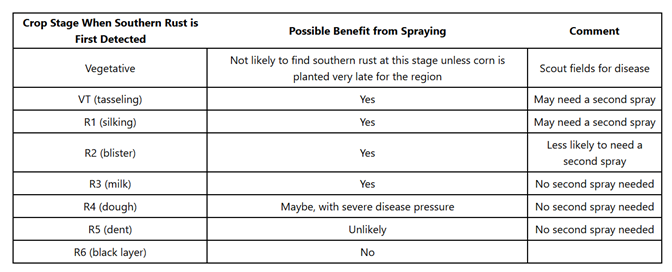
- Determine the crop growth stage, as fungicide applications are generally not recommended once corn reaches the dent (R5) stage (see Tables 1 and 2).
- Evaluate current and forecasted weather conditions using disease forecasting tools to estimate the risk of further disease development. https://cropprotectionnetwork.org/crop-disease-forecasting )
- Consider the economics of treatment by comparing the potential yield protection with the cost of the fungicide and application.
The tables below are handy to assist in making a fungicide decision based on detecting the disease, based our university data.
Table 1. A decision table for tar spot outlining possible benefits from applying fungicides based on when disease is first detected in a field and crop growth stage. Source: Crop Protection Network https://cropprotectionnetwork.org/maps/tar-spot-of-corn
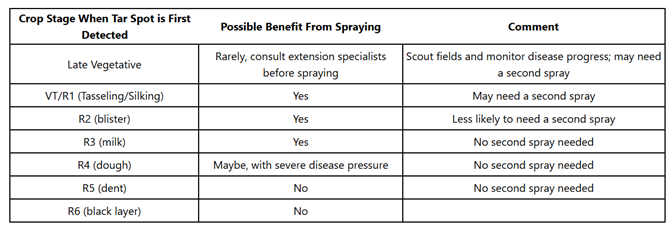
Table 2. A decision table for southern rust outlining possible benefits from applying fungicides based on when disease is first detected in a field and crop growth stage. Source: Crop Protection Network https://cropprotectionnetwork.org/maps/southern-corn-rust
We continue to documenting tar spot and southern rust as it is important to understand the disease distribution and severity across Indiana. All sample costs will continue to be covered for both these diseases and any others you might find in your corn or soybean fields. It is extremely important to know if this disease is present in your fields to implement disease management tools if necessary.
If you observe tar spot or southern rust in a county that has not reported this season or would like to share what you have been seeing on your farm, then please send a sample to the Purdue Plant Pest Diagnostic Lab (PPDL) https://ag.purdue.edu/btny/ppdl/Pages/Submit-A-Sample.aspx or contact me for further information (dtelenko@purdue.edu ).