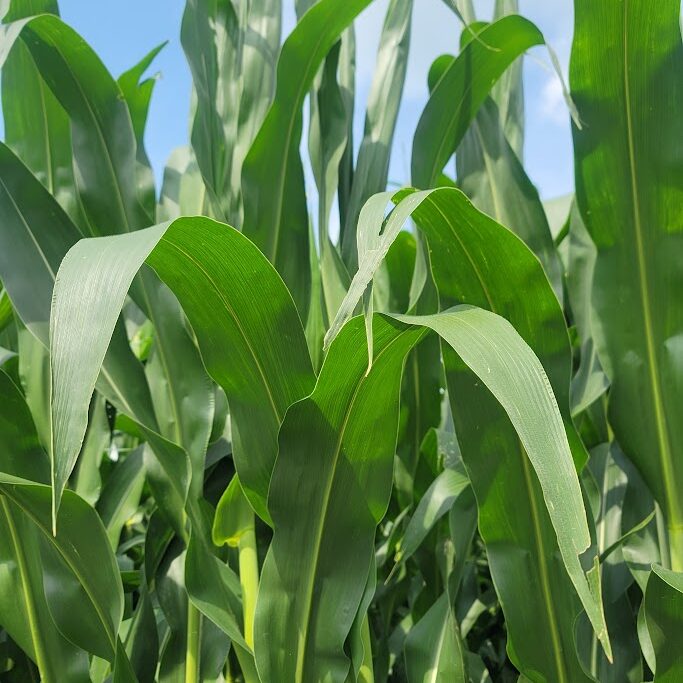
Continued scouting of both corn and soybean fields remains critical for making timely and informed disease management decisions. Crop development varies considerably across Indiana, with corn ranging from pollination to blister stages and most soybean fields at flowering through early pod set. During this week’s scouting efforts and through samples submitted to the Purdue Plant Pest Diagnostic Lab (PPDL), we observed tar spot (now beginning to increase in the lower corn canopy), along with gray leaf spot, Holcus spot, and Curvularia leaf spot. In soybean, only low levels of Septoria brown spot and a few frogeye leaf spot lesions have been detected, and overall disease pressure remains low in most fields. We also continue to confirm new counties with active tar spot detections across Indiana (Figure 1). In samples that are coming in now, it may be time to make a fungicide decision see below for more commentary.
As I mentioned last week, I was able to observe active red crown rot symptoms at the crown and soil line in a field where the disease had been previously confirmed. As the season progresses, please keep an eye out for suspect patches and symptomatic plants, and help us document and track the distribution of this disease across Indiana. Click here for more details.
A fungicide application can be effective at reducing disease and protecting yield, but there are a number of factors that need to be considered:
- Field history/previous crop – what diseases have been an issue in previous years?
- Amount of disease present in the field – what diseases are you finding? Where are they in the canopy? Is the disease active in your county or surrounding counties? What growth stage is the crop?
- Hybrid/variety susceptibility to diseases
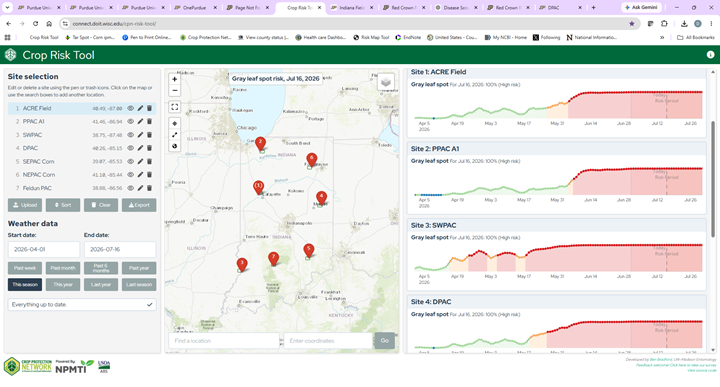
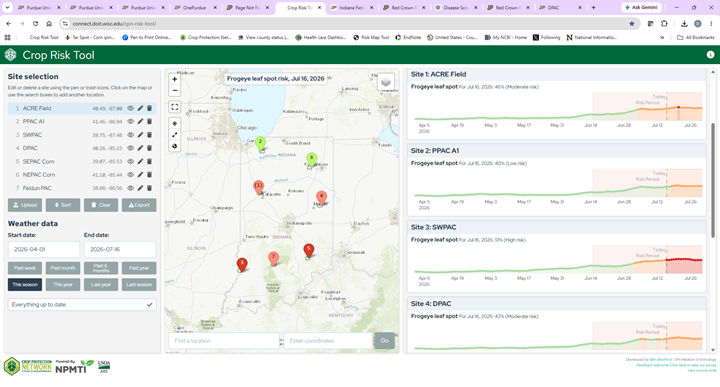
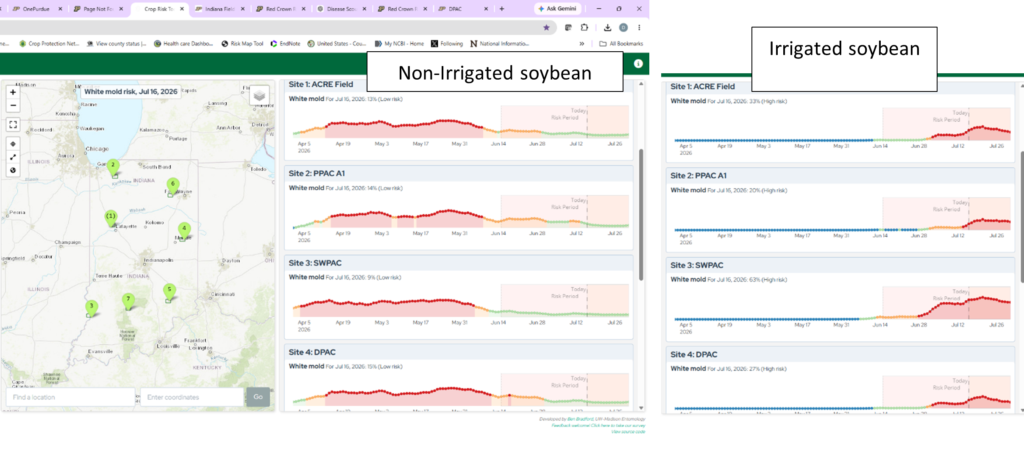
- Current weather conditions and disease risk models on Crop Protection Network (https://cropprotectionnetwork.org/crop-disease-forecasting). This website now hosts all the models tar spot (Fig 2), gray leaf spot (Fig 3), white mold (Fig 4), and frogeye leaf spot (Fig 5), so it’s a one stop shop. See below on commentary. I suggest book marking it on your favorite device and you can return to track the disease risks on your farm.
- The value of the crop and cost of fungicide application. Guest what we have a few tools to help with these as well.
- Fungicide efficacy tool (https://cropprotectionnetwork.org/fungicide-efficacy-tool ) – will search all the fungicide efficacy tables based on crop and disease of concern.
- Corn Fungicide ROI Calculator (https://cropprotectionnetwork.org/fungicide-efficacy-tool ) – calculate the potential return on investment (ROI) for corn fungicide application based on university uniform corn fungicide trials conducted in the United States and Canada.
- White Mold ROI Calculator (https://cropprotectionnetwork.org/white-mold-roi-calculator ) calculate the potential ROI for using white mold specific products on your farm based on university uniform white mold trials.
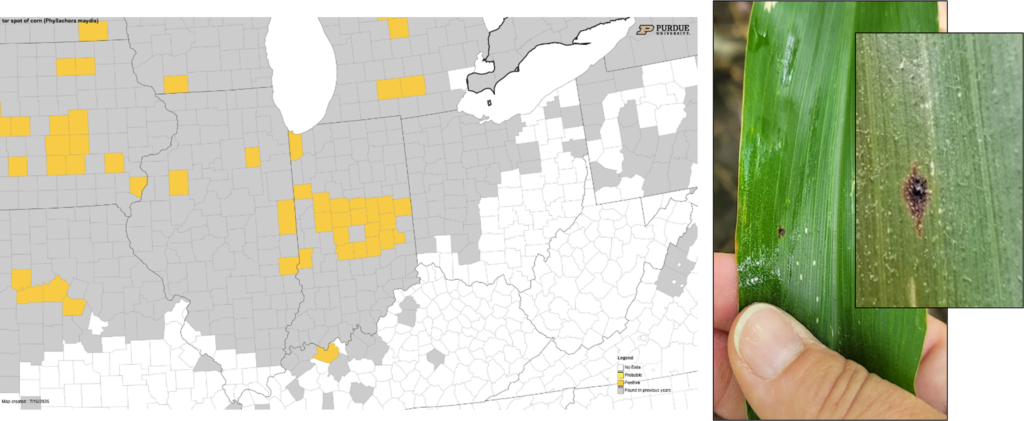
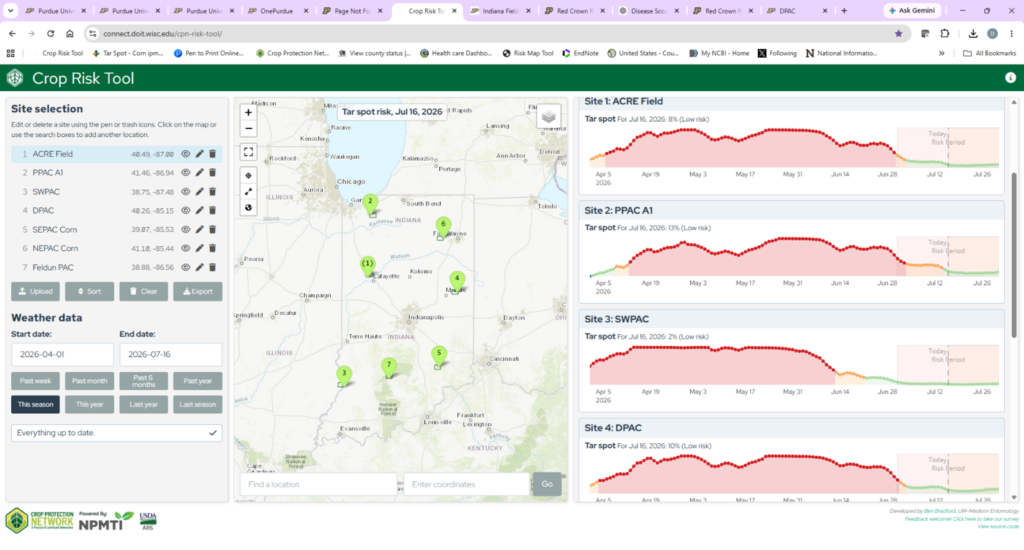
Tar Spot: Tar spot continues to be on everyone’s mind. We continue to add new counties where active tar spot lesions have been found in Indiana (Figure 1). We have confirmed active tar spot in 20 counties thus far this year. Tar spot had previously been found in all 92 Indiana counties. Many of these tar spot detections have required intensive scouting, but as the disease progresses it is becoming easier to find as the number of spots increase and it moves up the canopy. We will continue to monitor and update as the season continues.
See our publication on details for fungicide timing and applications for tar spot:
We continue to research best management practices for tar spot to minimize losses. The good news is that we found a number of fungicides are highly efficacious against tar spot when applied from tassel (VT) to milk (R3). I would recommend picking a product with multiple modes of action. The national Corn Disease Working Group has developed a very useful fungicide efficacy table for corn diseases (see links above). We will continue keeping a close eye on tar spot. Please contact me if you suspect a field has tar spot please or send a sample to the Purdue PPDL for confirmation. You can also share your disease sightings on the new Crop Lookout Tool https://cropprotectionnetwork.org/crop-lookout.
Southern Rust has not been officially confirmed in Indiana yet, but there are now a few reports in Missouri (Figure 6). I suspect southern rust might be found in southern Indiana where spores settled after moving on weather systems from the south. Southern rust pustules generally tend to occur on the upper surface of the leaf, and produce chlorotic symptoms on the underside of the leaf. These pustules rupture the leaf surface and are orange to tan in color. They are circular to oval in shape. We are also seeing some common rust as well and both diseases could be present on a leaf. There are a few characteristics to use to try to distinguish southern rust from common rust. Common rust will form pustules on both sides of the leaf. In addition, common rust pustules tend to be spread out across the leaf, and less densely clustered. Common rust pustules have a brick red to brown coloration and may be more elongated than southern rust pustules.
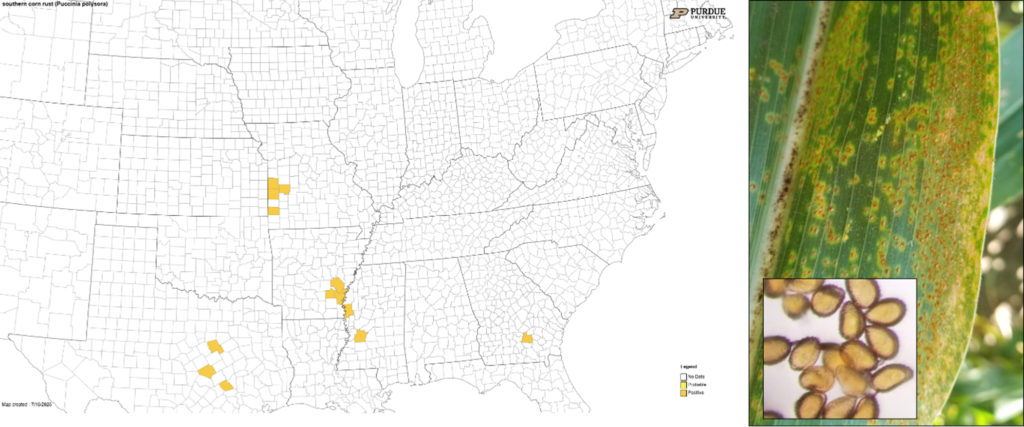
For additional images of southern rust and other diseases that can be confused with it, as well as guidance on fungicide decision-making, review the Crop Protection Network publication, An Overview of Southern Rust.
Southern rust does not overwinter in Indiana. Each year, spores (urediniospores) are carried north on air currents from tropical and southern production regions into Indiana corn fields. Infection requires periods of leaf wetness, and the morning dew commonly experienced in Indiana can provide the approximately six hours of moisture needed for disease development. Southern rust is favored by warm temperatures, with infection occurring most readily between 77 to 82°F. We need your help – if you are out scouting please let us know if you find any suspect samples and send to the Purdue Plant Pest Diagnostic Lab. We will need a physical sample in order to confirm southern rust. https://ag.purdue.edu/department/btny/ppdl/submit-samples/physical-submission.html
When considering a foliar fungicide application, several factors should be evaluated, including field history, current disease levels, hybrid susceptibility, weather conditions, crop value, and application costs. Numerous fungicides are available for managing foliar diseases. In corn, applications are generally most effective from the tassel (VT) to milk (R3). In soybean, fungicides are typically targeted at flowering between R1 and R3 for white mold management and around R1-R5 for frogeye leaf spot management when disease risk warrants treatment.
Resources:
- Fungicide efficacy table for corn diseases: https://cropprotectionnetwork.org/publications/fungicide-efficacy-for-control-of-corn-diseases
- Fungicide efficacy table for soybean foliar diseases: https://cropprotectionnetwork.org/publications/fungicide-efficacy-for-control-of-soybean-foliar-diseases
- Purdue Field Crop Pathology website for current updates https://indianafieldcroppathology.com/
As a reminder, to support monitoring of soybean and corn diseases across Indiana, diagnostic samples submitted by Indiana growers to the Purdue Plant Pest Diagnostic Laboratory (PPDL) for disease confirmation will be processed at no cost. This service is supported through checkoff-funded research provided by the Indiana Corn Marketing Council and Indiana Soybean Alliance. If you encounter significant disease concerns this season, please contact me at dtelenko@purdue.edu or the PPDL at ppdl-samples@purdue.edu for assistance with sample submission and diagnosis.