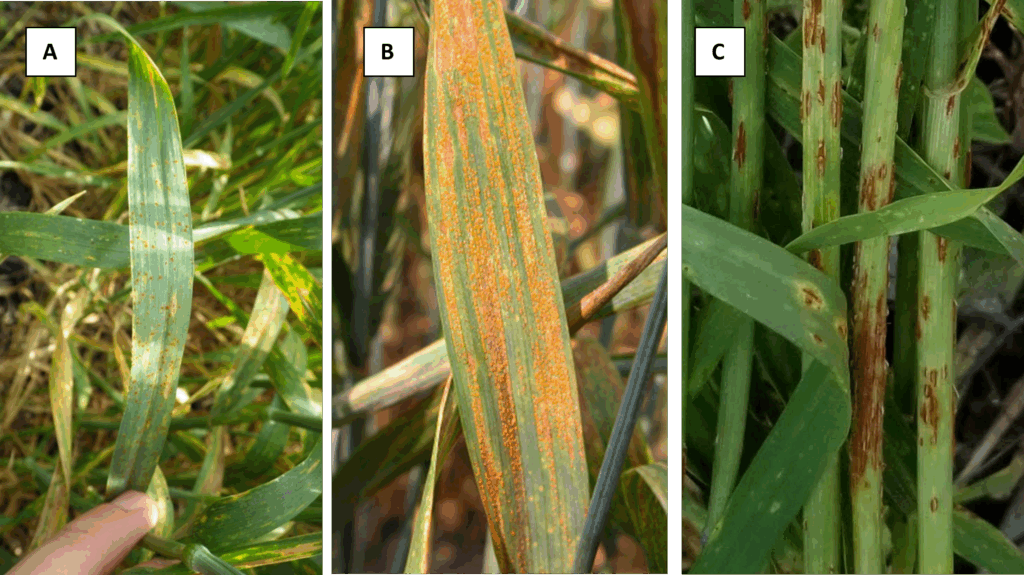
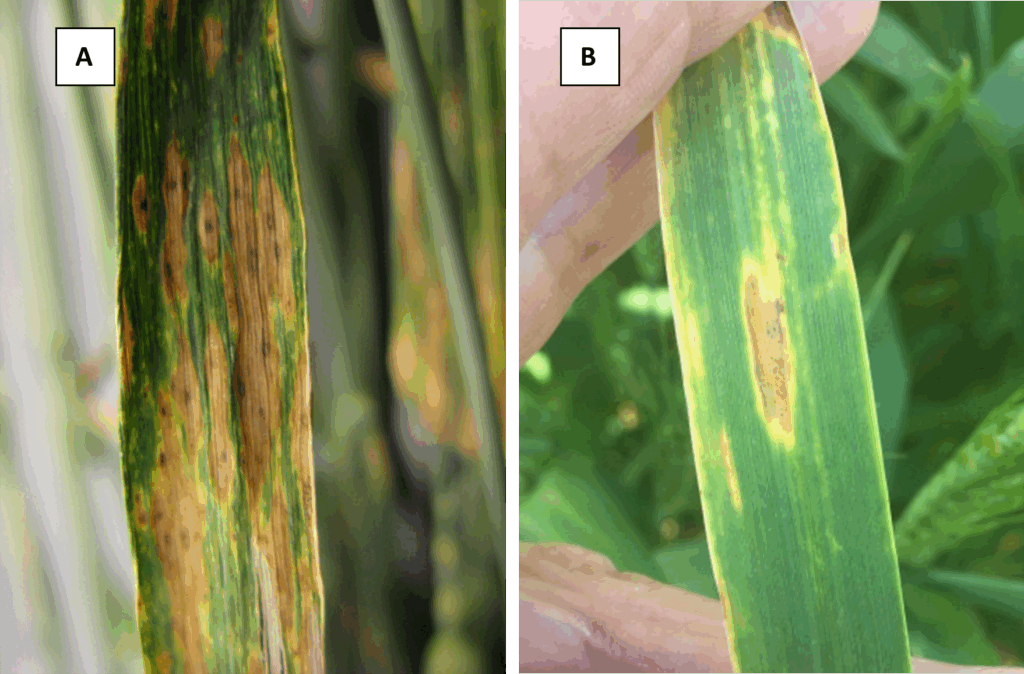
It is time to keep an eye on wheat for diseases and scab risk. There are a number of foliar diseases in wheat to watch out for. These include – leaf, strip and stem (Fig. 1A, B, C), Septoria leaf spot and tan spot (Fig. 2A, B). A number of resources are available to help distinguish wheat leaf diseases and “Identifying Rust Diseases of Wheat and Barley” and Crop Protection Network Encyclopedia
Wheat plant samples can always be submitted to the Purdue Plant Pest Diagnostic Lab for disease identification and confirmation.
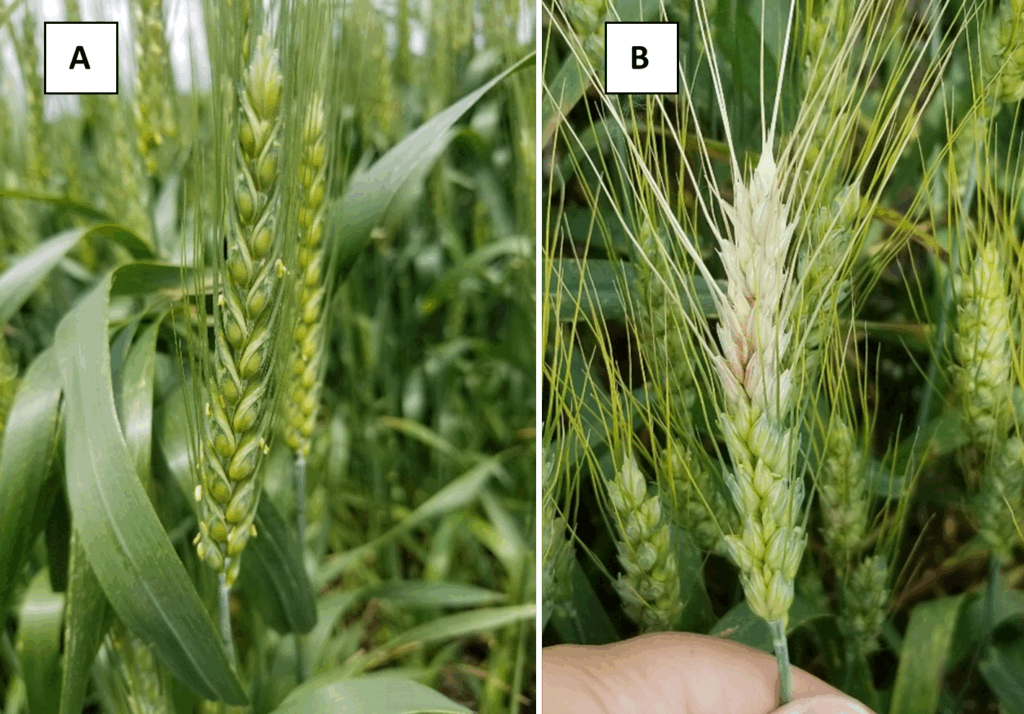
Wheat in southern Indians was flowering (Feekes 10.5.1) when I was in our plots in Vincennes on Saturday (April 25), which is a week or so earlier than I expected. Our plots in West Lafayette were at Feekes 9 (ligule of last leaf just visible). During flowering (anthesis, Fig 3A) warm, wet weather with high relative humidity will favor the development of Fusarium head blight (FHB, scab). Fusarium head blight (FHB) is caused by the fungus Fusarium graminearium. It infects wheat during flowering, beginning at Feekes 10.5.1. Symptoms of FHB will appear as bleaches spikelets on the head later in the season (Fig 3B). Infection can lead to small or shriveled grain kernels referred to as “tombstones.” In addition to shriveled grain this fungus produces mycotoxins such as deoxynivalenol (DON), which can accumulate in the infected grain.
A number of resources are available to help you make disease management decisions in wheat.
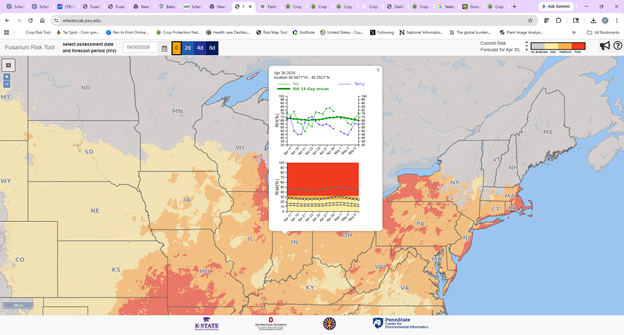
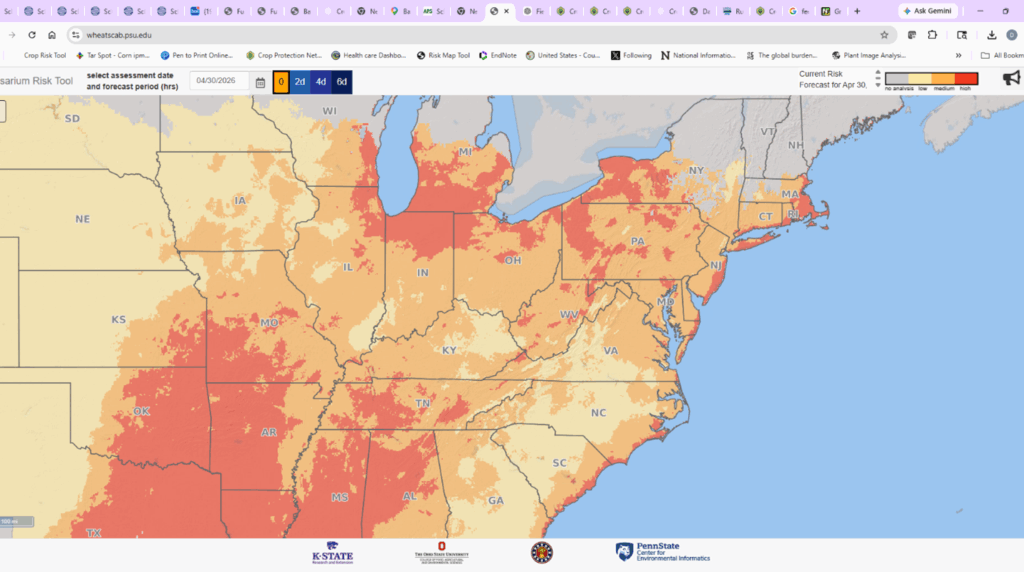
1) The Fusarium Risk Assessment Tool is available at the following website. http://www.wheatscab.psu.edu/. This tool estimates the risk of a Fusarium head blight epidemic (> than 10% field severity) using weather conditions (temperature, rainfall, and relative humidity) measured 15 days prior to flowering. See below for the current risk map – much of Indiana is colored yellow (medium risk for scab development) and red (high risk for scab development) due to recent wet weather.
Keep in mind that actual disease risk depends heavily on the growth stage of wheat in your area. The estimate is most relevant just prior to flowering (Feekes 10.5.1) or the early stages of grain development, due to recent rain the risk has shifted in Indiana from low to medium and high for a moderately susceptible cultivar. Fusarium head blight risk is highest when there are three or more days with extended periods of high relative humidity and moderate temperatures (65 to 80°F) during the early stages of kernel development.
Farmers and crop advisors can sign up for alerts from the U.S. Wheat and Barley Scab Initiative, these can be sent to a cell phone as a text or email. To sign up visit https://scabusa.org/scripts/FHB_Alerts/
2) Fungicide Application: A fungicide application might be considered if a Fusarium head blight (FHB) susceptible variety is planted, or if you are worried about scab on your farm. These applications should be made at Feekes 10.5.1, or early flowering to suppress FHB. Fungicides recommended for FHB and DON include Prosaro, Caramba, Proline, and Miravis Ace. The use of products containing strobilurin fungicides may result in higher levels of DON accumulation in grain when damaged by FHB. These are not labelled for FHB management.
Fungicide Efficacy Tablesare updated yearly and available from the Crop Protection Network
- Fungicide Efficacy for Control of Wheat Diseases CPN -3002 http://doi.org/10.31274/cpn-20190620-031
- Optimizing Fungicide Use for Fusarium Head Blight (Scab) and Associated Mycotoxins CPN-3001 (https://cropprotectionnetwork.org/publications/optimizing-fungicide-use-for-fusarium-head-blight-scab-and-associated-mycotoxins).
These tables can help you identify products to use based on your targeted disease. As a reminder follow the label on harvest restriction as some products may have 30 to 45 days required between last fungicide application and harvest.
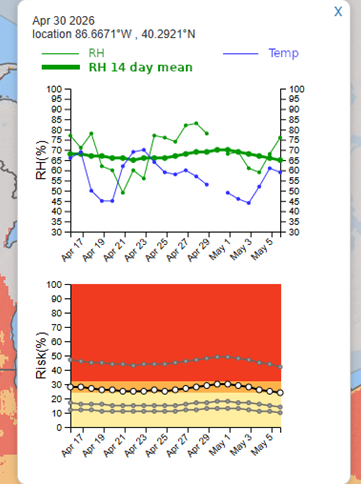
Most wheat is now entering the flowering stage, so fields should be monitored closely. The highest risk for Fusarium head blight occurs in fields planted with susceptible varieties or in fields with limited crop rotation, particularly those following wheat or corn. Looking at the wheat scab (Fusarium head blight) risk, most of Indiana is either medium (orange) to high (red), with a few pockets that are still low (yellow) (Fig 4). There’s a neat feature on the Scab risk map (https://www.wheatscab.psu.edu/) that enables users to view graphs of recent trends in humidity and disease. The graphs are activated by clicking on any point in the risk map. (Figures 5 and 6). Looking at this new feature if you have planted moderately susceptible (MS) cultivar the forecasted risk is remaining medium risk (orange) by May 5.